How Mid-Market Marketers Can Connect Marketing Visibility to Revenue

Mid-market marketing teams are under more pressure than ever. Expectations from executive leadership continue to rise. Budgets are scrutinized. Sales teams demand higher quality pipeline. Boards want predictable growth. At the same time, marketing teams are producing more content, running more campaigns, and managing more channels than at any point in the past.
Traffic is increasing. Engagement looks healthy. Campaign metrics appear strong.
Yet one question consistently surfaces in executive meetings:
How is marketing contributing to revenue?
For many mid-market organizations, the gap between marketing visibility and measurable revenue impact remains unclear. This is not because marketing is ineffective. It is because the systems, frameworks, and reporting structures needed to connect activity to outcomes are often incomplete.
This guide provides a practical roadmap for mid-market marketers who want to clearly connect visibility to pipeline and closed revenue. It includes real-world examples, relevant KPIs, dashboard structures that executive teams respect, and an overview of tools such as the RankWorks platform that help operationalize this process.
 Aligning marketing and sales funnels is critical for connecting visibility to revenue outcomes.
The Mid-Market Measurement Gap
Mid-market companies typically operate between startup agility and enterprise complexity. They may have established marketing automation and CRM systems, but processes are still evolving. Sales cycles are longer. Buying committees are larger. Attribution is rarely straightforward.
Common symptoms include:
- Growing website traffic but stagnant revenue
- Increasing lead volume but declining conversion rates
- Marketing reporting focused on impressions and clicks
- Executive skepticism about marketing ROI
- Misalignment between sales and marketing on what qualifies as a strong lead
Consider a B2B software company with $40 million in annual revenue. Their marketing team increased organic traffic by 65 percent over 12 months. Paid media performance improved. Content production doubled. However, pipeline only increased by 10 percent, and leadership questioned marketing effectiveness.
The problem was not performance. It was measurement. The team lacked a structured framework to connect traffic and engagement to qualified pipeline and revenue.
Mid-market marketing leaders must shift from reporting activity to reporting outcomes. Understanding the biggest challenges mid-market teams face is the first step toward building a revenue-connected marketing function.
Step One: Reverse Engineer Revenue Targets
Connecting visibility to revenue begins with revenue goals, not marketing metrics.
Start with the company growth plan.
Example:
- Annual revenue target: $60 million
- Current revenue: $50 million
- Growth required: $10 million
Now break that down.
If the average deal size is $50,000, the company needs 200 additional closed deals to reach the growth target.
If the historical close rate from opportunity to closed won is 25 percent, the company needs 800 qualified opportunities.
If the conversion rate from marketing qualified lead to opportunity is 20 percent, marketing must generate 4,000 marketing qualified leads.
This process transforms a broad revenue target into measurable marketing contributions.
Marketing visibility is no longer abstract. It becomes tied to a defined number of pipeline opportunities and closed deals.
This reverse engineering approach ensures that marketing planning aligns with revenue expectations from the beginning.
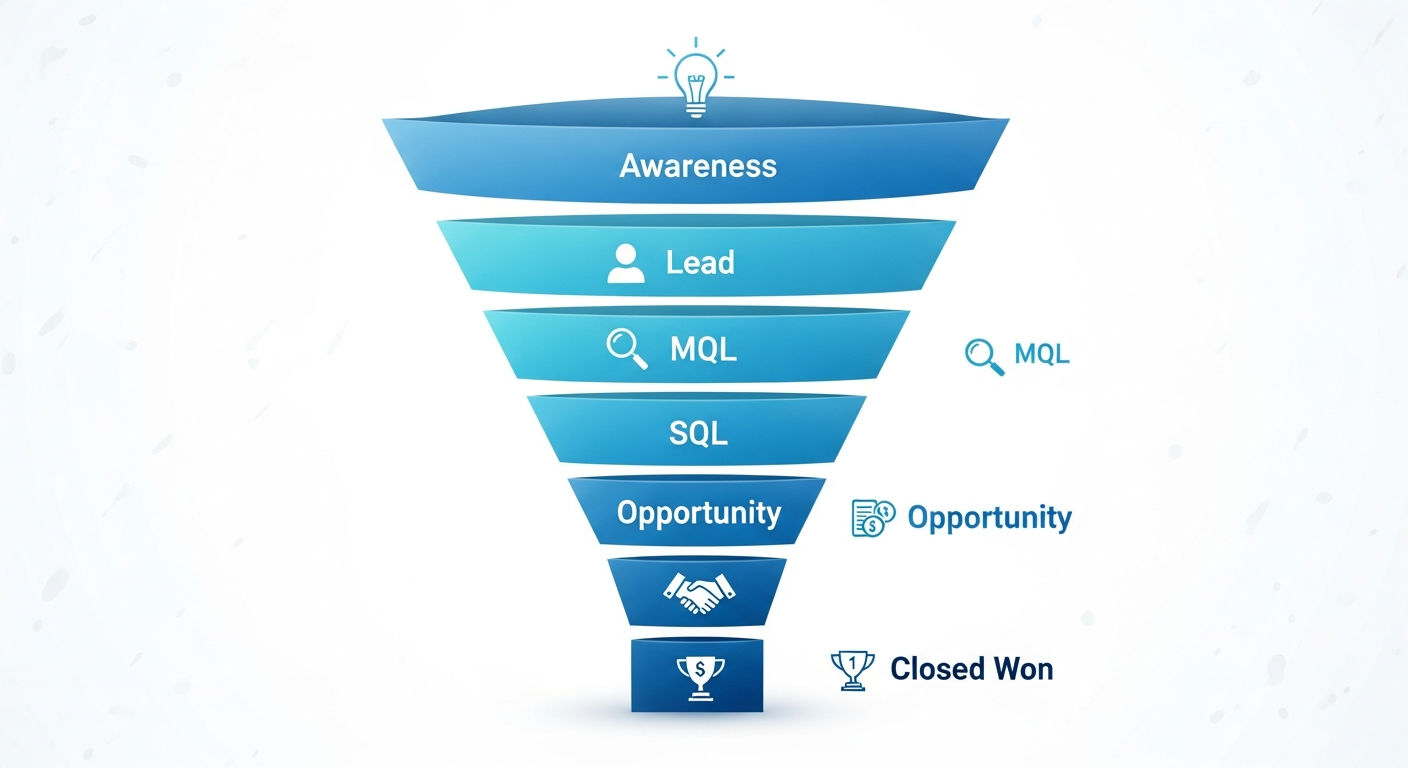
Step Two: Align Funnel Definitions Across Teams
One of the most significant barriers to revenue attribution is inconsistent funnel definitions.
Marketing may classify a content download as a qualified lead. Sales may disagree. Operations may use a different scoring model entirely.
Alignment must happen across five core stages:
- Lead
- Marketing Qualified Lead (MQL)
- Sales Qualified Lead (SQL)
- Opportunity
- Closed Won
Without shared definitions, reporting becomes subjective.
Real World Example
A mid-market manufacturing company generated over 3,000 leads per quarter. Marketing reported strong performance. Sales complained about lead quality. After alignment workshops, the teams redefined a marketing qualified lead as a prospect meeting specific industry, revenue, and engagement criteria.
Lead volume decreased by 40 percent. Opportunity creation increased by 22 percent within two quarters. The issue was not volume. It was clarity.
Tools such as the RankWorks platform help operationalize this alignment by providing structured visibility into performance across content, search, and campaign efforts, allowing teams to see how visibility initiatives influence lead quality and pipeline progression.
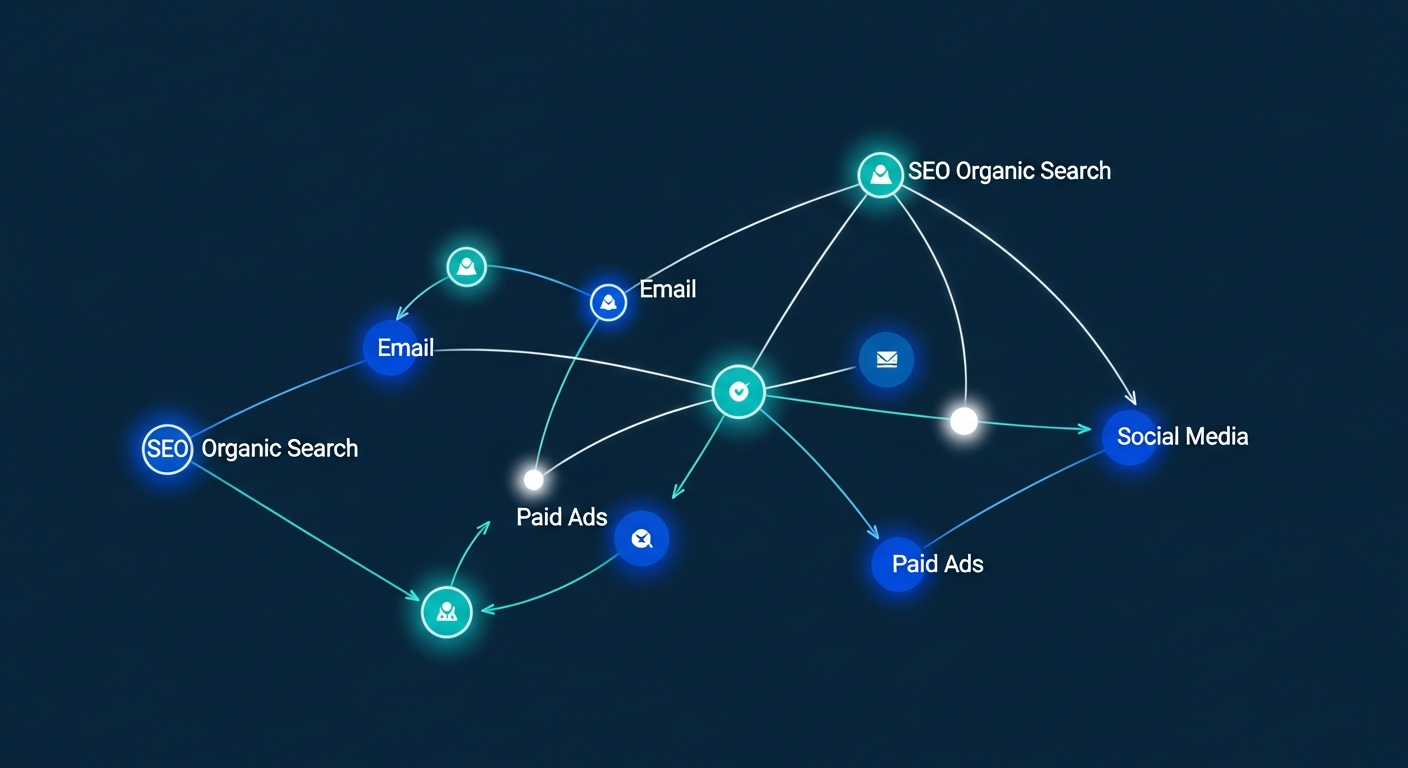
Step Three: Map Visibility to Pipeline Influence
Marketing visibility comes from multiple channels:
- Organic search
- Paid media
- Content marketing
- Email campaigns
- Social media
- Events and webinars
- Direct traffic from brand awareness
Each of these contributes differently to pipeline development.
For example:
- Organic search may drive early research stage prospects
- Webinars may drive high intent prospects ready for sales conversations
- Retargeting campaigns may accelerate stalled opportunities
A mid-market cybersecurity company discovered that 70 percent of closed deals had at least three organic search interactions before becoming opportunities. However, their reporting system credited revenue primarily to paid search because that was often the last click before a demo request.
By implementing multi-touch attribution and mapping channel influence across the funnel, the company gained a more accurate view of marketing's impact.
 Multi-touch attribution reveals the true influence of each marketing channel on pipeline generation.
Visibility became measurable because it was connected to progression through the funnel, not just initial engagement.
The RankWorks platform supports this type of mapping by helping marketing teams understand how search visibility and content performance align with buyer intent and competitive positioning, which ultimately influences pipeline generation.
Attribution Models That Work for Mid-Market Organizations
Attribution does not need to be overly complex. It must be consistent, transparent, and aligned with business realities.
First Touch Attribution
This model assigns credit to the first interaction a prospect has with the brand.
Benefits:
- Clear insight into demand generation channels
- Strong understanding of awareness drivers
Limitations:
- Does not account for multiple interactions
First touch is useful for understanding how visibility efforts such as SEO and thought leadership content introduce new prospects into the funnel.
Last Touch Attribution
This model credits the final interaction before conversion.
Benefits:
- Clear measurement of conversion triggers
- Simple implementation
Limitations:
- Undervalues early stage content and brand building
Many mid-market organizations rely heavily on last touch because it is easy to track. However, it often undervalues long term visibility initiatives.
Multi-Touch Attribution
This model distributes credit across multiple interactions.
Benefits:
- More realistic representation of modern buying journeys
- Recognizes the role of content, search, and retargeting
Limitations:
- Requires integrated systems
- Can be more complex to explain
A mid-market SaaS company adopted a multi-touch model and discovered that blog content influenced 62 percent of closed deals. Previously, that influence was invisible in executive reporting.
Revenue Weighted Attribution
Rather than counting leads, this model tracks revenue generated or influenced by each channel.
This approach resonates strongly with executive leadership because it directly answers the revenue question.
For mid-market teams seeking clarity, combining multi-touch visibility with revenue weighting provides a balanced and practical solution.
KPIs That Executive Teams Respect
Vanity metrics rarely survive executive scrutiny. C-suite leaders focus on growth, efficiency, predictability, and risk mitigation.
The following KPIs shift the conversation from activity to outcomes.
Marketing Sourced Pipeline
Total pipeline value generated directly from marketing initiatives.
Example: A professional services firm tracked marketing sourced pipeline and found that content driven inbound leads generated $12 million in new opportunities over one fiscal year. This metric immediately demonstrated marketing's strategic value.
Marketing Influenced Revenue
Closed won revenue where marketing had measurable interaction. This includes prospects who engaged with content, webinars, search results, or campaigns before closing.
Customer Acquisition Cost (CAC)
Total marketing and sales spend divided by new customers acquired. Executives appreciate this metric because it reflects efficiency and profitability.
Pipeline Conversion Rates
Track conversion percentages between stages:
- Lead to Marketing Qualified Lead
- Marketing Qualified Lead to Opportunity
- Opportunity to Closed Won
If conversion rates decline, leadership can investigate bottlenecks.
Pipeline Velocity
Measures how quickly prospects move through the funnel. Faster velocity increases revenue predictability.
Revenue Per Channel
Tracks closed revenue attributed to specific marketing channels. This metric helps inform budget allocation decisions.
Platforms such as RankWorks provide visibility into how organic search presence, content performance, and competitive positioning influence pipeline creation, enabling marketers to report channel level impact with greater confidence.
Building Executive Dashboards That Drive Confidence
 Executive dashboards should be concise, revenue-focused, and easy to interpret.
An executive dashboard should be concise, revenue focused, and easy to interpret.
Consider structuring dashboards in four core sections.
Revenue Overview
- Annual revenue target versus actual
- Marketing sourced revenue
- Marketing influenced revenue
- Pipeline coverage ratio
Pipeline coverage ratio compares total pipeline value to revenue targets.
Example: If the revenue target is $10 million and the current pipeline equals $30 million with a historical close rate of 33 percent, the pipeline coverage is sufficient.
Pipeline Health
- Total pipeline value
- Opportunities by stage
- Conversion rates between stages
- Average sales cycle length
Channel Performance
- Pipeline generated by channel
- Revenue generated by channel
- Cost per opportunity
- Return on marketing investment
Forecast Indicators
- Marketing qualified lead trends
- Opportunity creation trends
- Sales cycle acceleration metrics
Dashboards should be updated consistently and presented in executive meetings with context and insight, not just raw numbers.
Real World Case Study: B2B Technology Firm
A mid-market B2B technology company with $75 million in annual revenue faced executive skepticism about marketing ROI.
Marketing reported:
- 120,000 monthly website visitors
- 8,000 monthly leads
- 20 percent email engagement rates
Despite these numbers, pipeline growth was inconsistent.
After implementing a revenue connected framework:
- They reverse engineered revenue targets into required opportunities.
- They aligned funnel definitions with sales leadership.
- They implemented multi-touch attribution within their CRM.
- They integrated search visibility data from the RankWorks platform to better understand competitive keyword positioning and content impact on buyer journeys.
Results after 12 months:
- Marketing sourced pipeline increased by 38 percent
- Marketing influenced revenue increased by 42 percent
- Customer acquisition cost decreased by 18 percent
- Executive confidence in marketing performance improved significantly
The key was not more activity. It was clearer visibility into revenue contribution.
The Role of Search Visibility in Revenue Growth
Organic search remains one of the most powerful visibility drivers for mid-market companies. However, without clear attribution, its impact is often underestimated.
Search visibility influences:
- Early stage awareness
- Competitive comparison research
- Educational content engagement
- High intent product searches
The RankWorks platform helps mid-market marketing teams track search visibility across priority keywords, identify competitive gaps, and connect performance improvements to lead generation trends.
When search performance data integrates into revenue reporting, marketing teams can demonstrate how improvements in organic rankings correlate with pipeline growth.
Building a Culture of Revenue Accountability
Technology enables attribution. Culture sustains it.
High performing mid-market organizations:
- Tie marketing goals directly to revenue targets
- Include marketing leaders in revenue planning discussions
- Share pipeline metrics transparently
- Reward cross functional collaboration
Marketing becomes a growth engine rather than a cost center.
When visibility initiatives such as SEO, content marketing, and paid media are tied to measurable revenue outcomes, executive trust increases.
The Strategic Advantage of Clarity
Mid-market companies operate in competitive environments. Enterprise competitors often have larger budgets. Startups may move faster.
The advantage mid-market organizations can build is clarity.
Clarity in:
- Revenue goals
- Funnel definitions
- Attribution models
- KPI selection
- Dashboard reporting
- Visibility optimization
By leveraging integrated tools and platforms such as RankWorks to improve search visibility and competitive insight, marketing teams can directly influence pipeline creation and revenue growth.
When marketing visibility is connected to pipeline metrics, and pipeline metrics are connected to revenue outcomes, the ROI conversation changes.
Executives no longer ask whether marketing is working.
They ask how to scale what is already driving revenue.
Final Thoughts
Connecting marketing visibility to revenue is not about eliminating creative experimentation or reducing marketing to spreadsheets. It is about ensuring that visibility initiatives are aligned with business growth objectives.
Mid-market marketers who reverse engineer revenue goals, align with sales, implement practical attribution models, focus on meaningful KPIs, and leverage platforms such as RankWorks to enhance search visibility and competitive insight can transform marketing from an activity driven function into a measurable revenue engine.
Visibility is the starting point. Pipeline is the bridge. Revenue is the outcome.
When those three elements are connected through clear frameworks and disciplined execution, mid-market marketing teams gain the credibility, confidence, and strategic influence needed to drive sustainable growth.
Ready to connect your marketing visibility to revenue? Request a demo to see how RankWorks can help your team build a revenue-connected marketing strategy, or start with a free SEO audit to understand your current search visibility.
Frequently Asked Questions
What does it mean to connect marketing visibility to revenue?
Connecting marketing visibility to revenue means establishing clear, measurable pathways between your marketing activities (such as organic search rankings, content engagement, and campaign performance) and actual pipeline creation and closed deals. Instead of reporting on impressions or traffic alone, marketing teams track how visibility efforts contribute to qualified leads, opportunities, and revenue growth.
Why is marketing attribution especially difficult for mid-market companies?
Mid-market companies face unique attribution challenges because they often have longer sales cycles, multiple decision makers in the buying committee, and marketing technology stacks that are still maturing. Unlike enterprise organizations with dedicated analytics teams or startups with simple funnels, mid-market businesses must balance complexity with limited resources.
What is the best attribution model for a mid-market B2B company?
For most mid-market B2B organizations, a multi-touch attribution model combined with revenue weighting provides the most balanced and actionable insights. This approach recognizes that buyers interact with multiple marketing touchpoints before making a purchase decision, while also connecting those interactions directly to revenue outcomes rather than just lead counts.
How do I reverse engineer revenue targets into marketing goals?
Start with your annual revenue growth target. Divide by average deal size to determine how many new deals you need. Apply your historical close rate to calculate required opportunities. Then use your MQL-to-opportunity conversion rate to determine the number of marketing qualified leads needed. This gives marketing a concrete, revenue-aligned target.
What KPIs should I present to executive leadership?
Focus on metrics that directly relate to business outcomes: marketing sourced pipeline, marketing influenced revenue, customer acquisition cost (CAC), pipeline conversion rates, pipeline velocity, and revenue per channel. Avoid reporting primarily on vanity metrics like impressions, clicks, or social media followers.
How can search visibility directly impact pipeline and revenue?
Search visibility places your brand and content in front of prospects at critical moments in their buying journey, from early research to active comparison to purchase intent. Improving rankings for high-intent keywords increases the probability that qualified prospects discover your solution, enter your funnel, and eventually convert to paying customers.
What is pipeline coverage ratio and why does it matter?
Pipeline coverage ratio compares your total pipeline value to your revenue target. A commonly cited benchmark is 3x coverage (three dollars in pipeline for every dollar of target revenue). This metric matters because it indicates whether you have enough pipeline to realistically hit your revenue goals, even after accounting for natural deal attrition.
How do I align sales and marketing on lead definitions?
Schedule alignment workshops where both teams agree on specific criteria for each funnel stage (Lead, MQL, SQL, Opportunity, Closed Won). Define what actions, demographic attributes, and engagement levels qualify a prospect to move between stages. Document these definitions and review them quarterly.
What role does content marketing play in revenue attribution?
Content marketing often influences the majority of the buyer journey, even when it does not receive last-touch credit. Blog posts, guides, case studies, and webinars educate prospects, build trust, and accelerate movement through the funnel. Multi-touch attribution models reveal this influence, often showing that content touches 50 percent or more of closed deals.
How can I get started with connecting marketing visibility to revenue at my organization?
Begin by reverse engineering your revenue targets into marketing goals. Then align funnel definitions with your sales team. Implement basic multi-touch tracking in your CRM. Build an executive dashboard focused on pipeline and revenue metrics rather than activity metrics. Use a platform like RankWorks to track search visibility and competitive positioning as part of your overall marketing performance framework.
Related Resources
Explore more insights to enhance your digital marketing strategy