Part of the Marketing Attribution Guide
Marketing Attribution: Models, Measurement & Revenue Impact →Brand Impact Measurement: Proving Brand Drives Pipeline

How B2B marketing leaders quantify brand investment impact on pipeline, revenue velocity, and win rate using modern measurement methods.
Brand investment in B2B is one of the most difficult lines to defend in a budget review. Unlike paid search or email, where you can draw a direct line from spend to leads, brand advertising seems to produce nothing you can point to on a Monday morning pipeline call. CFOs see brand as feel-good spending. Revenue leaders see it as off-strategy. And marketing leaders who can't quantify it end up cutting it every time they face a budget crunch — often the exact moment when brand investment would have the greatest long-term return.
The problem isn't that brand doesn't drive pipeline. Research consistently shows it does — often accounting for 20–40% of long-run revenue growth in B2B markets. The problem is that brand operates on a delayed timeline and through indirect mechanisms that traditional attribution systems are designed to ignore.
This guide covers how to measure brand impact accurately, make it visible to finance and leadership, and build the measurement infrastructure that turns brand from a cost centre into a defensible strategic investment.
Why Brand Measurement Is Still Broken in B2B
Most B2B companies measure brand using one of three flawed approaches.
The first is vanity metrics: impressions, reach, share of voice on social, award wins. These are activity metrics, not impact metrics. They tell you your ads were served or your LinkedIn follower count grew — not whether any of that produced commercial value.
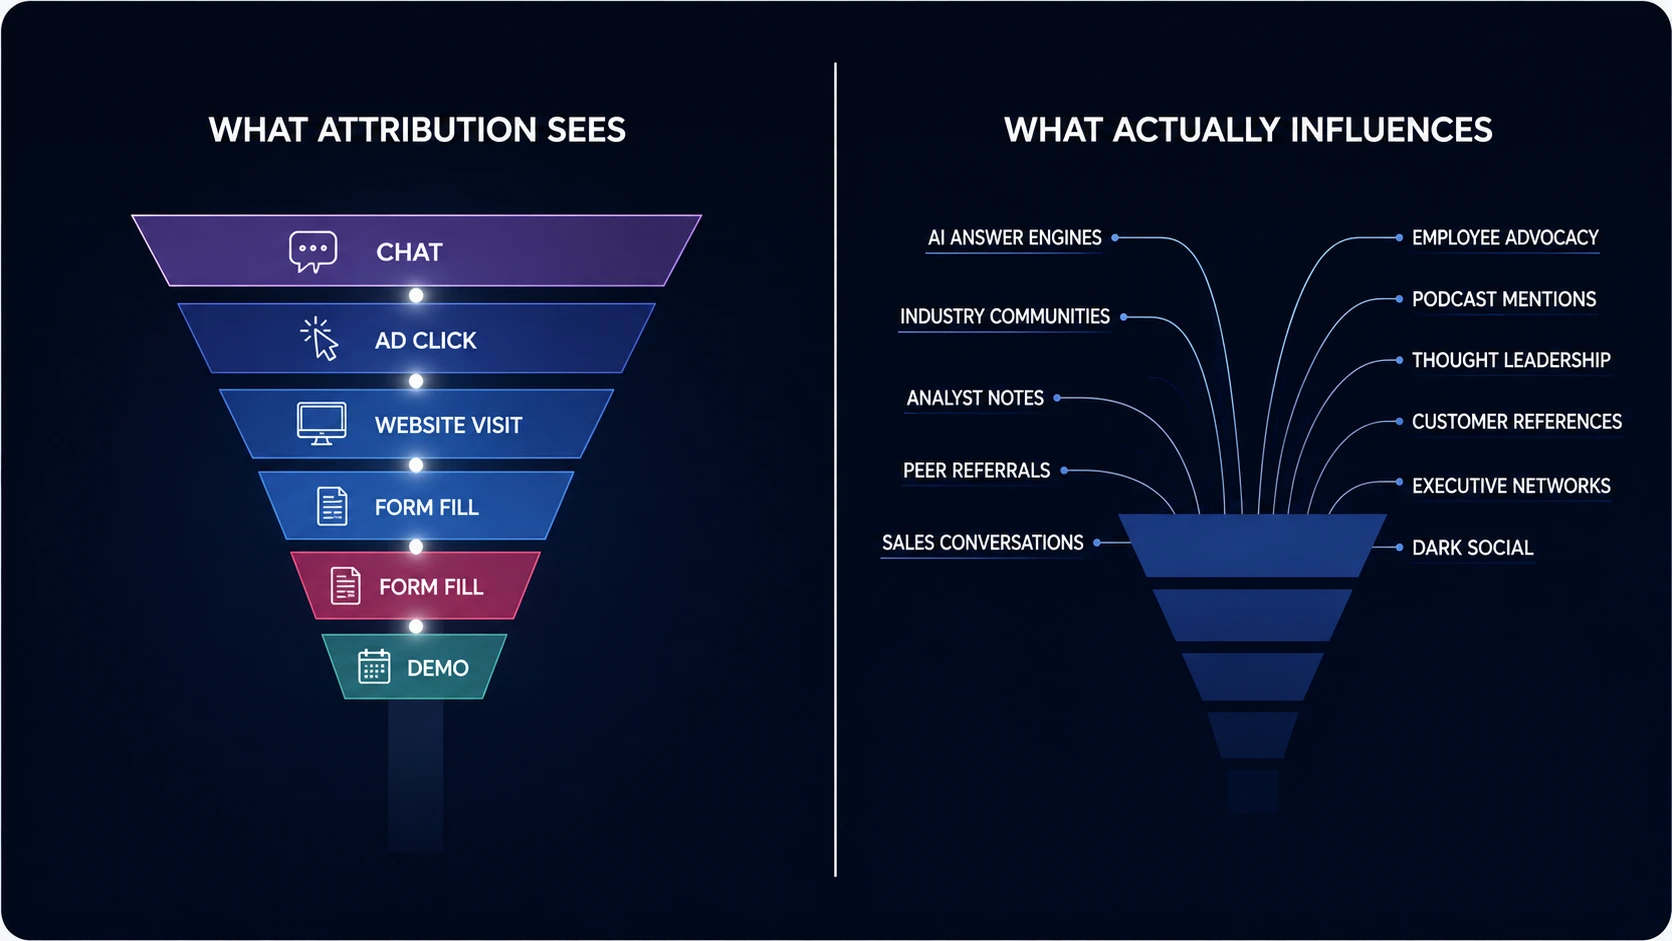
The second is attribution by proxy: assigning brand credit when a contact's first touch was a brand awareness ad. This is better than nothing, but it significantly undervalues brand. Most of brand's impact is on the quality and velocity of deals that don't have brand as a visible first touch — it shows up as higher win rates, shorter sales cycles, and better-qualified pipeline because buyers already knew and trusted you before your SDR called.
The third is surveying. Awareness and consideration surveys are the most commonly used brand measurement tools in B2B, but without a control group and consistent methodology, they produce directional data at best. Many brand tracking studies are designed to confirm the narrative rather than test it.
All three approaches fail because they don't isolate causality. They can show correlation — when we ran a brand campaign, awareness went up — but they can't separate brand's contribution from all the other variables that simultaneously affected business outcomes.
What Brand Impact Actually Means in B2B

Before you can measure brand impact, you need a precise definition of what you're measuring. In B2B, brand drives commercial value through four primary mechanisms:
Awareness and category entry: When a buyer enters the market for a solution like yours, they start with a consideration set. Companies they've heard of, read about, or have associations with. Brand investment determines whether you're in that initial consideration set, which research from Bain shows is the most predictive factor of eventual purchase. B2B buyers rarely evaluate vendors they've never heard of, even when the solution would serve them well.
Win rate improvement: Companies with stronger category brand recognition win a higher percentage of competitive evaluations, even when functional product differentiation is similar. This is because brand creates perceived risk reduction — a buyer choosing a well-known vendor is making a defensible decision, while choosing a lesser-known vendor requires a stronger internal business case.
Sales cycle compression: Buyers who are familiar with your brand before engaging sales convert faster. They've already done some of the research, they arrive with a more favourable starting position, and they require less education. LinkedIn B2B Institute research found that brand-familiar buyers converted to customers 50–60% faster than brand-unfamiliar buyers across a sample of B2B technology companies.
Price premium and expansion: Brand strength reduces price sensitivity in both initial deals and renewals. Customers who have strong brand associations with a vendor are more willing to pay a price premium and more likely to expand their usage, because the relationship is perceived as high value beyond the functional attributes of the product.
Brand Metrics That Connect to Revenue
The metrics that make brand measurable in revenue terms are different from traditional brand awareness metrics. Focus on these six:
Branded search volume: The monthly volume of searches for your company name and product name variations in Google. Branded search is one of the most reliable proxies for aided brand awareness — people searching for you specifically already know you exist. Track this over time and against competitor branded search volume. Rising branded search, particularly when correlated with brand investment activity, is a strong indicator of awareness growth.
Direct and dark traffic share: The percentage of your website sessions that arrive via direct URL entry or with no referral. As brand familiarity increases, more buyers visit you directly rather than through search or paid channels. A rising direct traffic share — controlling for seasonal effects — is evidence of growing brand recognition.
Win rate by brand familiarity segment: Segment your won and lost deals by whether the buyer had prior brand familiarity — measured by whether they had any first-party engagement (website visit, content download, webinar attendance) before their first sales contact. Track win rate by segment over time. If brand investment is working, the brand-familiar segment should have a higher and rising win rate.
Sales cycle length by entry type: Compare average sales cycle length for inbound opportunities (who sought you out) vs. outbound (who received cold outreach). Over time, as brand investment builds awareness, the outbound cycle length should shorten as prospects arrive with more prior knowledge.
Share of voice (SOV) vs. share of market (SOM): The long-run correlation between SOV and SOM is one of the most empirically robust findings in marketing science. Companies whose SOV exceeds their SOM tend to gain market share. Track your SOV across key B2B media channels (LinkedIn, industry publications, G2 review volume, podcast mentions) against competitors. SOV above SOM is a leading indicator of future market share growth.
Pipeline source quality by brand exposure: Use your MAP to segment pipeline by whether the account had prior brand exposure (saw a brand ad, visited organic content, engaged with thought leadership) vs. no prior brand exposure. Compare average deal size, close rate, and expansion revenue between these segments.
Using Marketing Mix Modeling to Isolate Brand Contribution
Marketing Mix Modeling (MMM) is the gold standard for quantifying brand impact at scale because it can isolate brand's contribution to revenue outcomes while controlling for all other variables: paid demand gen, sales activity, economic environment, and competitive activity.
MMM works by fitting a statistical model to historical data — typically two or more years of weekly or monthly data — covering marketing spend by channel, sales outcomes, and external factors. The model produces coefficients that represent each channel's incremental contribution to revenue, including brand channels like out-of-home advertising, podcasts, brand content, and sponsorships.
Critically, MMM can measure the long-run effects of brand investment that performance attribution misses. Most attribution models look at 30–90 day windows. MMM can model the "adstock" effect — the gradual decay of brand impressions over time — and shows that brand investment typically continues to generate revenue lift for 6–18 months after the spend occurs. This is the core reason brand gets undervalued in attribution models and why MMM produces a fundamentally different picture of brand ROI.
Companies like Nielsen, Analytic Partners, and Ekimetrics run commercial MMM for large B2B advertisers. Smaller B2B teams can run simplified MMM models using open-source tools like Robyn (Meta's open-source MMM framework) or Lightweight MMM from Google, though these require data science resources to implement correctly.
Brand Lift Studies and How to Run Them in B2B
Brand lift studies measure the causal impact of a specific brand campaign on awareness, consideration, and preference by comparing exposed and unexposed audiences. Unlike passive tracking surveys, lift studies have a control group — making them a genuine experiment rather than a correlation study.
In B2B, LinkedIn offers a native brand lift study tool for LinkedIn campaigns. You define a target audience, run your campaign, and LinkedIn randomly splits the audience into an exposed group (who saw the ads) and a holdout control group (who didn't). After the campaign, both groups are surveyed on brand awareness and consideration questions. The lift is the difference in positive response between exposed and control groups.
For campaigns running across multiple channels, you can run a more complex geographic lift study: identify matched market pairs (cities, regions, or industry verticals with similar baseline characteristics), run the brand campaign in the test market but not the control market, and compare business outcomes (pipeline, win rate, sales cycle length) between markets over the subsequent 6–12 months.
Geographic lift studies are resource-intensive but produce the most defensible evidence of brand ROI for executive presentations. B2B brands like Salesforce, HubSpot, and Drift have all used geographic holdout tests to quantify the pipeline impact of brand investment.
Share of Voice as a Leading Indicator

Share of voice is the most practical leading indicator of future commercial outcomes for brand investment. The mechanism was validated by Nielsen's long-run analysis of FMCG brand data and has since been replicated in B2B contexts by researchers at the Ehrenberg-Bass Institute and others.
The rule is straightforward: if your share of voice in your category exceeds your share of market, you're likely to gain market share over the next 12–24 months. If your SOV is below your SOM, you're at risk of share erosion as competitor brands compound their advantage.
In B2B, SOV is harder to measure than in consumer markets because there's no single "share of voice" metric. You need to construct a composite from multiple signals: share of organic search rankings in your category, share of LinkedIn impression volume among your audience, share of G2 reviews and star rating, share of industry publication mentions, and share of branded keyword search volume compared to your primary competitors.
Tracking this quarterly and correlating it against pipeline and revenue growth provides a practical way to demonstrate that brand investment is building commercial momentum, even before the full revenue impact is visible in attribution data.
The Brand-to-Demand Feedback Loop
Brand investment works most efficiently when it's integrated with demand generation rather than run as a separate programme. The brand-to-demand loop works like this: brand investment builds awareness and positive associations across your target market. When demand gen activity (outbound, paid search, content) reaches those same buyers, conversion rates are materially higher because the brand has already done work to establish familiarity and trust.
LinkedIn's B2B Institute quantified this in a study of B2B technology buyers. Buyers who had been exposed to LinkedIn brand advertising converted to pipeline at a rate 6.4 times higher when subsequently reached by direct response advertising, compared to buyers who saw only direct response ads with no prior brand exposure. The brand created the conditions under which demand gen could work efficiently.
This has direct implications for budget allocation. Teams that run brand investment as a persistent always-on programme — not just during product launches or fiscal year-end pushes — and layer demand gen on top see better performance from every demand gen dollar spent. The two functions are multipliers of each other, not independent investments.
Building a Brand Measurement Report for the CFO
The brand measurement framework needs a CFO-facing output that translates brand metrics into commercial language. This doesn't mean oversimplifying — it means choosing the metrics that CFOs actually care about: pipeline, revenue, and efficiency.
A practical brand measurement report for leadership review includes three sections: Brand Health (branded search trends, SOV, awareness survey scores), Commercial Correlation (win rate by brand familiarity, sales cycle by entry type, pipeline quality by brand exposure), and Modelled Attribution (MMM output for brand channels if available, or a linear-adjusted estimate of brand contribution to pipeline based on first-touch data enhancement).
Benchmark against competitors wherever possible. A CFO who sees that your branded search volume grew 25% YoY while a competitor's declined 10% — and that win rate in competitive deals improved 8 percentage points over the same period — has the evidence to support continued brand investment. Numbers in isolation are less compelling than numbers that demonstrate competitive advantage.
Frequently Asked Questions
How much of B2B revenue is typically driven by brand?
Marketing mix modeling studies consistently show brand investment accounting for 20–40% of long-run revenue growth in B2B, though the effect varies significantly by category, competitive intensity, and sales cycle length. Companies in highly competitive markets with long sales cycles tend to see the largest brand impact on win rates and sales cycle compression.
Why does standard attribution undervalue brand?
Standard attribution — especially last-touch or 30-day multi-touch — captures only the immediate, trackable touchpoints before conversion. Brand impact operates over months and years, building awareness and trust that influences deals without appearing as a trackable touchpoint. Marketing Mix Modeling is the primary tool for capturing these long-run effects that attribution systematically misses.
What's the easiest brand metric to start tracking today?
Branded search volume in Google Search Console or Google Trends. It's free, correlates reliably with aided brand awareness, and can be benchmarked against competitors. Track it monthly and look for the correlation with your brand investment activity over a 6–12 month period.
How do I run a brand lift study on a limited budget?
LinkedIn's native brand lift study tool is the most accessible option for B2B brands. You need a LinkedIn campaign budget of approximately $90,000 or more to generate statistically significant results, which limits it to larger advertisers. For smaller budgets, pre/post awareness surveys run through Lucid or Pollfish at the target persona level provide directional lift data without the statistical rigour of a true holdout experiment.
How long does it take for brand investment to show up in pipeline?
The lead time between brand investment and measurable pipeline impact is typically 6–18 months. This is the primary reason brand gets cut — the ROI lag makes it invisible in quarterly reviews. MMM adstock models show that the average B2B brand impression continues generating revenue lift for 9–12 months after it's served, which is why brand investment needs to be evaluated on an annual or multi-year basis, not a quarterly one.
What's the right budget split between brand and demand gen?
The Les Binet and Peter Field research (The Long and Short of It) recommends a 60:40 split in favour of brand in most mature markets. In B2B, the research suggests a 46:54 split (brand:demand) as a starting point, with adjustments for market share, growth stage, and competitive intensity. High-growth companies entering a market typically run higher demand investment; established category leaders benefit more from brand protection.
Key Takeaways
- Brand investment in B2B is often seen as non-essential.
- Brand drives 20-40% of long-term revenue growth in B2B.
- Traditional measurement methods fail to isolate brand impact.
- Brand familiarity leads to faster conversions and higher win rates.
Frequently Asked Questions
- Why is brand investment hard to justify in B2B?
- Brand investment lacks direct attribution to leads, making it appear as feel-good spending to CFOs.
- What are the common flaws in B2B brand measurement?
- Common flaws include vanity metrics, proxy attribution, and unreliable surveys that fail to isolate causality.
- How does brand awareness affect buyer behavior?
- Brand awareness influences the initial consideration set, making it crucial for buyers when evaluating vendors.
- What metrics should be used to measure brand impact?
- Focus on metrics that connect brand investment to revenue outcomes, rather than traditional awareness metrics.
See Where Your Business Stands in Search
Get a free site audit. We identify what is holding you back and what to fix first.
Related Resources
Explore more insights to enhance your digital marketing strategy
Revenue Attribution Platform
Connect every marketing dollar to closed revenue. Multi-touch attribution, incrementality testing, and board-ready reporting in one place.
Revenue Attribution: Models, Measurement & Revenue
Every attribution model explained — from first-touch to data-driven — with a framework for choosing the right one for your pipeline.
See It Run on Your Pipeline
Book a demo and see the unified measurement framework applied to your own revenue data. No slide decks — just your numbers.